plot

Convenience methods for plotting graphs within the cityseer API context. Custom behaviour can be achieved by directly manipulating the underlying NetworkX and matplotlib figures. This module is predominately used for basic plots or visual verification of behaviour in code tests. Users are encouraged to use matplotlib or other plotting packages directly where possible.

ColourMap

Specifies global colour presets.

ColourMap

ColourMap
( )

plot_nx_primal_or_dual

plot_nx_primal_or_dual
(
primal_graph
dual_graph
path : str | None = None
labels : bool = False
primal_node_size : int = 30
primal_node_colour
primal_edge_colour
dual_node_size : int = 30
dual_node_colour
dual_edge_colour
primal_edge_width : int | float | None = None
dual_edge_width : int | float | None = None
plot_geoms : bool = True
x_lim : tuple[float, float] | None = None
y_lim : tuple[float, float] | None = None
ax : matplotlib.axes._axes.Axes | None = None
**kwargs
)

Plot a primal or dual cityseer graph.

Parameters

primal_graph
MultiGraph

An optional NetworkX MultiGraph to plot in the primal representation. Defaults to None.

dual_graph
MultiGraph

An optional NetworkX MultiGraph to plot in the dual representation. Defaults to None.

path
str

An optional filepath: if provided, the image will be saved to the path instead of being displayed. Defaults to None.

labels
bool

Whether to display node labels. Defaults to False.

primal_node_size
int

The diameter for the primal graph’s nodes.

primal_node_colour
str | float | ndarray

Primal node colour or colours. When passing an iterable of colours, the number of colours should match the order and number of nodes in the MultiGraph. The colours are passed to the underlying draw_networkx # pylint: disable=line-too-long method and should be formatted accordingly. Defaults to None.

primal_edge_colour
str | float | ndarray

Primal edge colour or colours. When passing an iterable of colours, the number of colours should match the order and number of edges in the MultiGraph. The colours are passed to the underlying draw_networkx # pylint: disable=line-too-long method and should be formatted accordingly. Defaults to None.

dual_node_size
int

The diameter for the dual graph’s nodes.

dual_node_colour
str | float | ndarray

Dual node colour or colours. When passing a list of colours, the number of colours should match the order and number of nodes in the MultiGraph. The colours are passed to the underlying draw_networkx # pylint: disable=line-too-long method and should be formatted accordingly. Defaults to None.

dual_edge_colour
str | float | ndarray

Dual edge colour or colours. When passing an iterable of colours, the number of colours should match the order and number of edges in the MultiGraph. The colours are passed to the underlying draw_networkx # pylint: disable=line-too-long method and should be formatted accordingly. Defaults to None.

primal_edge_width
float

Linewidths for the primal edge. Defaults to None.

dual_edge_width
float

Linewidths for the dual edge. Defaults to None.

plot_geoms
bool

Whether to plot the edge geometries. If set to False, straight lines will be drawn from node-to-node to represent edges. Defaults to True.

x_lim
tuple[float, float]

A tuple or list with the minimum and maxium x extents to be plotted. Defaults to None.

y_lim
tuple[float, float]

A tuple or list with the minimum and maxium y extents to be plotted. Defaults to None.

ax
plt.Axes

An optional matplotlib ax to which to plot. If not provided, a figure and ax will be generated.

**kwargs
None

kwargs which will be passed to the matplotlib figure parameters. If provided, these will override the default figure size or dpi parameters.

Notes

Plot either or both primal and dual representations of a networkX MultiGraph. Only call this function directly if explicitly printing both primal and dual graphs. Otherwise, use the simplified plot_nx method instead.

from cityseer.tools import mock, graphs, plot
G = mock.mock_graph()
G_simple = graphs.nx_simple_geoms(G)
G_dual = graphs.nx_to_dual(G_simple)
plot.plot_nx_primal_or_dual(G_simple,
                            G_dual,
                            plot_geoms=False)

Example primal and dual graph plot. 
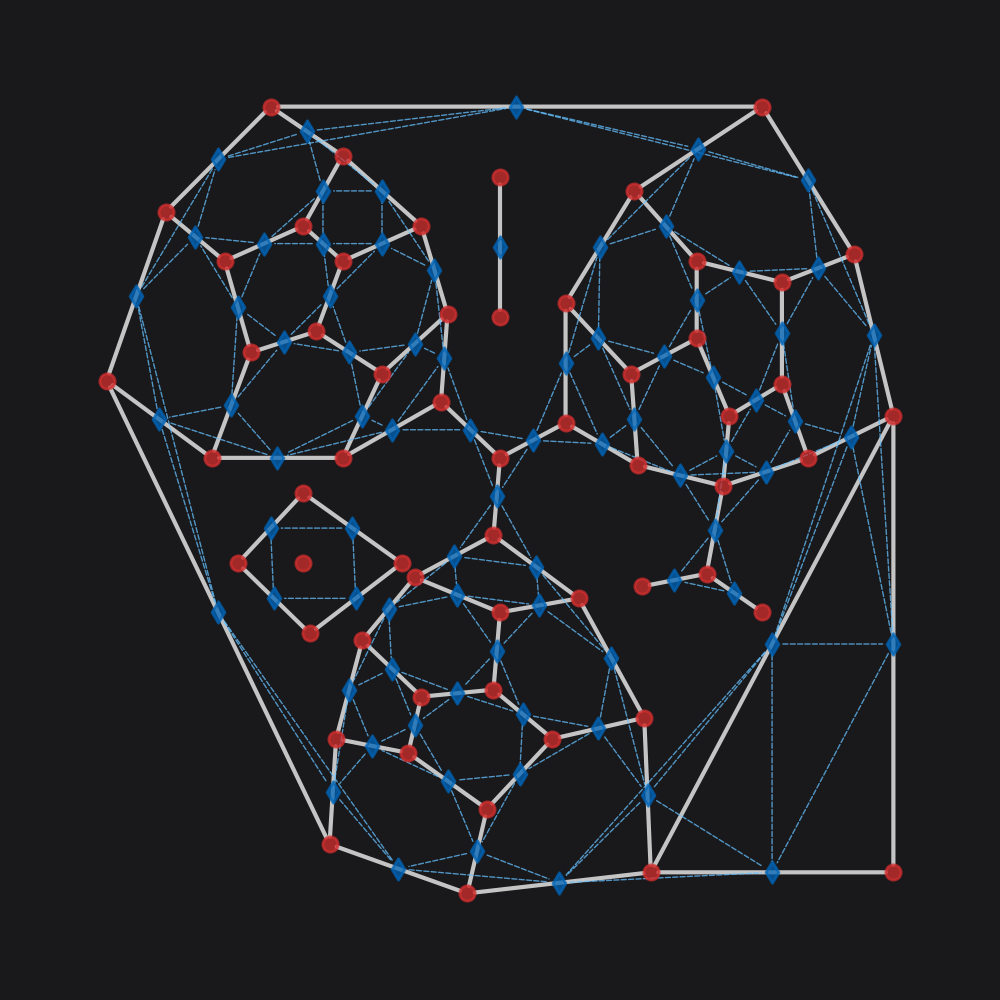
A dual graph in blue overlaid on the source primal graph in red.

plot_nx

plot_nx
(
nx_multigraph
path : str | None = None
labels : bool = False
node_size : int = 20
node_colour
edge_colour
edge_width : int | float | None = None
plot_geoms : bool = False
x_lim : tuple[float, float] | None = None
y_lim : tuple[float, float] | None = None
ax : matplotlib.axes._axes.Axes | None = None
**kwargs
)

Plot a networkX MultiGraph.

Parameters

nx_multigraph
MultiGraph

A NetworkX MultiGraph.

path
str

An optional filepath: if provided, the image will be saved to the path instead of being displayed. Defaults to None.

labels
bool

Whether to display node labels. Defaults to False.

node_size
int

The diameter for the graph’s nodes.

node_colour
str | float | ndarray

Node colour or colours. When passing an iterable of colours, the number of colours should match the order and number of nodes in the MultiGraph. The colours are passed to the underlying draw_networkx # pylint: disable=line-too-long method and should be formatted accordingly. Defaults to None.

edge_colour
str | float | ndarray

Edges colour as a matplotlib compatible colour string. Defaults to None.

edge_width
float

Linewidths for edges. Defaults to None.

plot_geoms
bool

Whether to plot the edge geometries. If set to False, straight lines will be drawn from node-to-node to represent edges. Defaults to True.

x_lim
tuple[float, float]

A tuple or list with the minimum and maximum x extents to be plotted. Defaults to None.

y_lim
tuple[float, float]

A tuple or list with the minimum and maximum y extents to be plotted. Defaults to None.

ax
plt.Axes

An optional matplotlib ax to which to plot. If not provided, a figure and ax will be generated.

**kwargs
None

kwargs which will be passed to the matplotlib figure parameters. If provided, these will override the default figure size or dpi parameters.

Notes

from cityseer.tools import mock, graphs, plot, io
from cityseer.metrics import networks
from matplotlib import colors

# generate a MultiGraph and compute gravity
G = mock.mock_graph()
G = graphs.nx_simple_geoms(G)
G = graphs.nx_decompose(G, 50)
nodes_gdf, edges_gdf, network_structure = io.network_structure_from_nx(G, crs=3395)
networks.node_centrality_shortest(
    network_structure=network_structure,
    nodes_gdf=nodes_gdf,
    distances=[800]
)
G_after = io.nx_from_cityseer_geopandas(nodes_gdf, edges_gdf)
# let's extract and normalise the values
vals = []
for node, data in G_after.nodes(data=True):
    vals.append(data["cc_beta_800"])
# let's create a custom colourmap using matplotlib
cmap = colors.LinearSegmentedColormap.from_list(
    "cityseer", [(100 / 255, 193 / 255, 255 / 255, 255 / 255), (211 / 255, 47 / 255, 47 / 255, 1 / 255)]
)
# normalise the values
vals = colors.Normalize()(vals)
# cast against the colour map
cols = cmap(vals)
# plot
plot.plot_nx(G_after, node_colour=cols)

Example Colour Plot. 
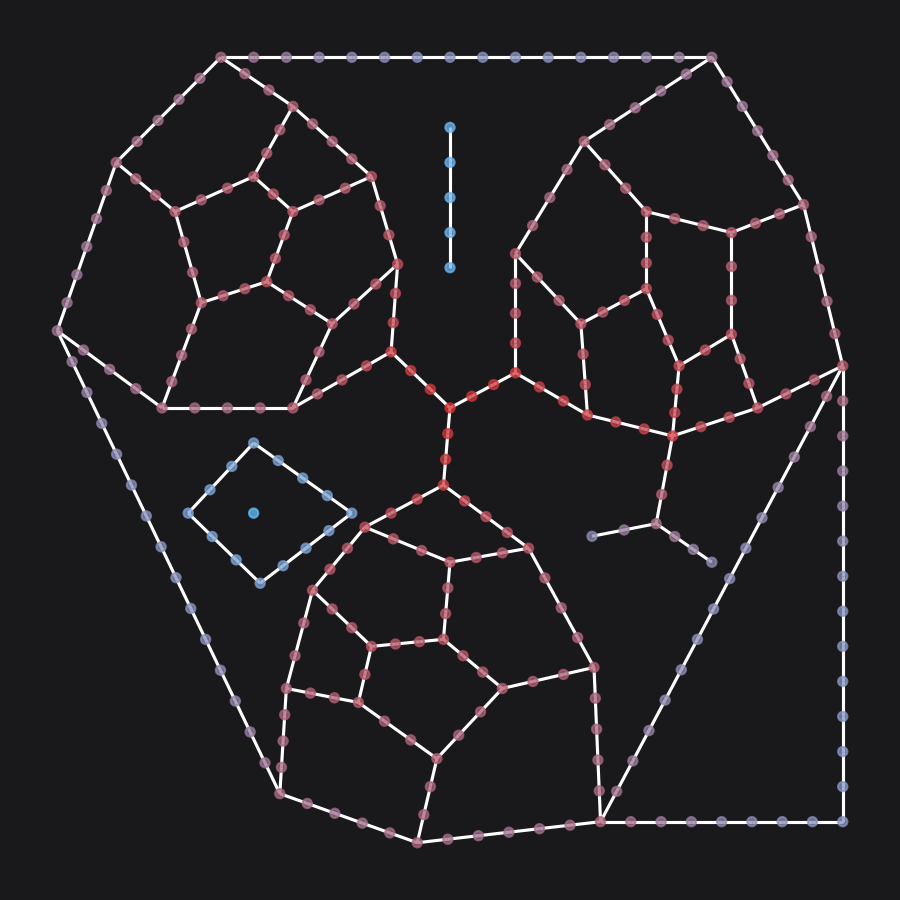
Colour plot of 800m gravity index centrality on a 50m decomposed graph.

plot_assignment

plot_assignment
(
network_structure : NetworkStructure
nx_multigraph
data_gdf : geopandas.geodataframe.GeoDataFrame
path : str | None = None
node_colour
node_labels : bool = False
data_labels
**kwargs
)

Plot a network_structure and data_gdf for visualising assignment of data points to respective nodes.

This method is primarily intended for package testing and development.

Parameters

network_structure
rustalgos.NetworkStructure

nx_multigraph
MultiGraph

A NetworkX MultiGraph.

data_gdf
GeoDataFrame

A data_gdf GeoDataFrame with nearest_assigned and next_neareset_assign columns.

path
str

An optional filepath: if provided, the image will be saved to the path instead of being displayed. Defaults to None.

node_colour
str | float | ndarray

Node colour or colours. When passing a list of colours, the number of colours should match the order and number of nodes in the MultiGraph. The colours are passed to the underlying draw_networkx # pylint: disable=line-too-long method and should be formatted accordingly. Defaults to None.

node_labels
bool

Whether to plot the node labels. Defaults to False.

data_labels
ndarray[int | str]

An optional iterable of categorical data labels which will be mapped to colours. The number of labels should match the number of data points in data_layer. Defaults to None.

**kwargs
None

kwargs which will be passed to the matplotlib figure parameters. If provided, these will override the default figure size or dpi parameters.

Notes

Example assignment plot. 
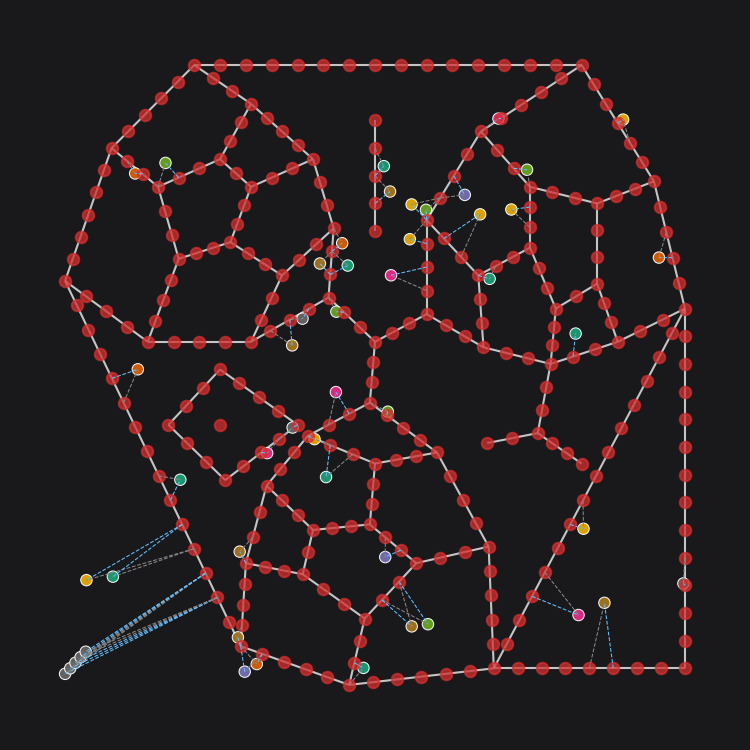
An assignment plot to a 50m decomposed graph, with the data points coloured by categorical labels.

plot_network_structure

plot_network_structure
(
network_structure : NetworkStructure
data_gdf : geopandas.geodataframe.GeoDataFrame
poly : shapely.geometry.polygon.Polygon | None = None
)

Plot a graph from raw cityseer network structure.

Note that this function is subject to frequent revision pending short-term development requirements. It is used mainly to visually confirm the correct behaviour of particular algorithms during the software development cycle.

Parameters

network_structure
rustalgos.NetworkStructure

data_gdf
GeoDataFrame

A data_gdf GeoDataFrame with nearest_assigned and next_neareset_assign columns.

poly
geometry.Polygon

An optional polygon. Defaults to None.

plot_scatter

plot_scatter
(
ax : matplotlib.axes._axes.Axes
xs
ys
vals
bbox_extents : tuple[int, int, int, int] | tuple[float, float, float, float]
perc_range : tuple[float, float] = (0.01, 99.99)
cmap_key : str = 'viridis'
shape_exp : float = 1
s_min : float = 0.1
s_max : float = 1
rasterized : bool = True
face_colour : str = '#111'
)

Convenience plotting function for plotting outputs from examples in the Cityseer Guide.

Parameters

ax
plt.Axes

A ‘matplotlib’ Ax to which to plot.

xs
ndarray[float]

A numpy array of floats representing the x coordinates for points to plot.

ys
ndarray[float]

A numpy array of floats representing the y coordinates for points to plot.

vals
ndarray[float]

A numpy array of floats representing the data values for the provided points.

bbox_extents
tuple[int, int, int, int]

A tuple or list containing the [s, w, n, e] bounding box extents for clipping the plot.

perc_range
tuple[float, float]

A tuple of two floats, representing the minimum and maximum percentiles at which to clip the data.

cmap_key
str

A matplotlib colour map key.

shape_exp
float

A float representing an exponential for reshaping the values distribution. Defaults to 1 which returns the values as provided. An exponential greater than or less than 1 will shape the values distribution accordingly.

s_min
float

A float representing the minimum size for a plotted point.

s_max
float

A float representing the maximum size for a plotted point.

rasterized
bool

Whether or not to rasterise the output. Recommended for plots with a large number of points.

face_colour
str

A hex or other valid matplotlib colour value for the ax and figure faces (backgrounds).

plot_nx_edges

plot_nx_edges
(
ax : matplotlib.axes._axes.Axes
nx_multigraph : networkx.classes.multigraph.MultiGraph
edge_metrics_key : str
bbox_extents : tuple[int, int, int, int] | tuple[float, float, float, float]
perc_range : tuple[float, float] = (0.01, 99.99)
cmap_key : str = 'viridis'
shape_exp : float = 1
lw_min : float = 0.1
lw_max : float = 1
edge_label_key : str | None = None
colour_by_categorical : bool = False
max_n_categorical : int = 10
rasterized : bool = True
face_colour : str = '#111'
invert_plot_order : bool = False
)

Convenience plotting function for plotting outputs from examples in the Cityseer Guide.

Parameters

ax
plt.Axes

A ‘matplotlib’ Ax to which to plot.

nx_multigraph
MultiGraph

A NetworkX MultiGraph.

edge_metrics_key
str

An edge key for the provided nx_multigraph. Plotted values will be retrieved from this edge key.

bbox_extents
tuple[int, int, int, int]

A tuple or list containing the [s, w, n, e] bounding box extents for clipping the plot.

perc_range
tuple[float, float]

A tuple of two floats, representing the minimum and maximum percentiles at which to clip the data.

cmap_key
str

A matplotlib colour map key.

shape_exp
float

A float representing an exponential for reshaping the values distribution. Defaults to 1 which returns the values as provided. An exponential greater than or less than 1 will shape the values distribution accordingly.

lw_min
float

A float representing the minimum line width for a plotted edge.

lw_max
float

A float representing the maximum line width for a plotted edge.

edge_label_key
str

A key for retrieving categorical labels from edges.

colour_by_categorical
bool

Whether to plot colours by categorical. This requires an edge_label_key parameter.

max_n_categorical
int

The number of categorical values (sorted in decreasing order) to plot.

rasterized
bool

Whether or not to rasterise the output. Recommended for plots with a large number of edges.

face_colour
str

A hex or other valid matplotlib colour value for the ax and figure faces (backgrounds).

invert_plot_order
bool

Whether to invert the plot order, e.g. if using an inverse colour map.